After going back and forth between my academic commitments and Maritime Optima, I finally finished my master's thesis in Artificial Intelligence (AI) at the Norwegian University of Science and Technology, marking a significant milestone in my academic journey. AI has always captivated my curiosity, especially recently with its remarkable accomplishments and growing potential. My master's thesis explores this further, focusing on AI's potential role as a tool for knowledge acquisition, specifically in the complex field of maritime trade analysis.
AI for Knowledge Acquisition
The rise of AI has prompted a paradigm shift in how we acquire knowledge and approach problem-solving. The sheer computational power and decision-making capabilities of AI algorithms have begun to outshine human capabilities in certain fields, challenging conventional wisdom and opening new horizons of understanding.
An exemplary illustration of this phenomenon is Google's AlphaGo - the AI that triumphed over Lee Sedol, the human world champion in the centuries-old board game Go. The game of Go is deeply rooted in strategic thinking, requiring players to anticipate an opponent's moves and plan several steps ahead. Conventional wisdom, developed over thousands of years, seemed unassailable until AlphaGo made an unexpected move deemed 'non-human' by human experts. Surprisingly, these novel moves were instrumental in securing AlphaGo's victory, making us reconsider our established principles.
These compelling demonstrations of AI's potential raise a thought-provoking question: If an AI can redefine the strategy of a game so meticulously studied for centuries, what else can it uncover in other domains that we are yet to realize?
Unraveling Maritime Trade with AIS
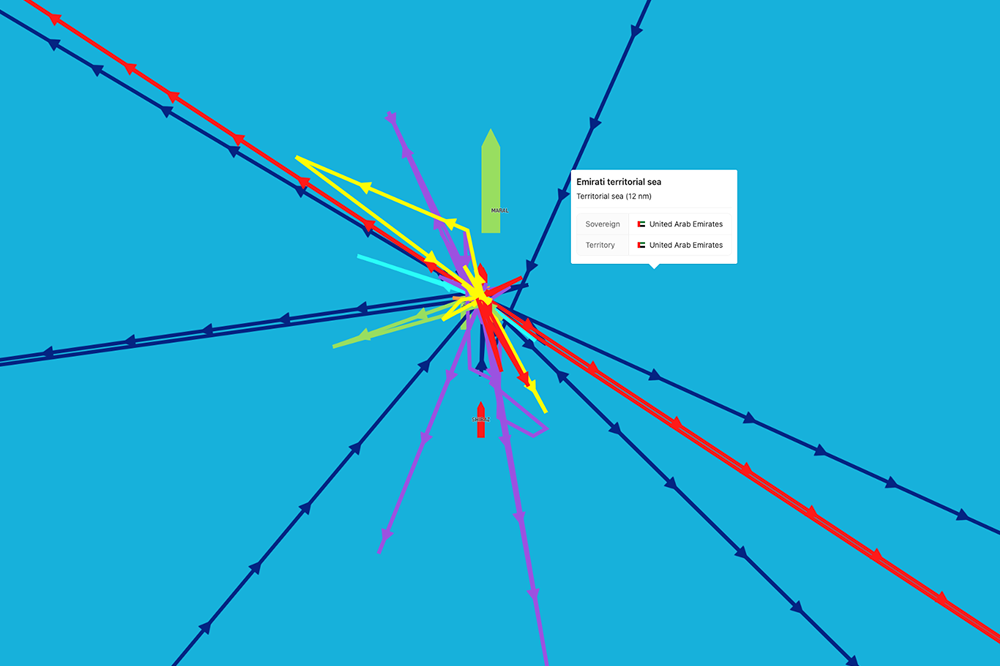
Given my work with Maritime Optima and the pool of expert opinions that I could tap into at the company, it was only logical to select a domain where these professionals could assist in evaluating the decisions of these AI systems. Therefore, the complex and multifaceted field of maritime trade proved to be a fertile ground for exploration. Moreover, our AIS-derived data, now of superior quality, was well-prepared for these analytical processes.
Within the industry, it's well recognized that a strong correlation exists between the movements of the world fleet - encompassed in AIS data elements such as speed and draft - and the broader market trends. Yet, the causal link between these two aspects is still not fully understood and is often a matter of debate. Do the market dynamics dictate fleet movements, or do they influence market trends? Here's where the 'chicken or the egg' analogy came into play: It's logical to assume that fleet movements react to market changes, adapting to demand and supply shifts. However, the idea of fleet movements having a reciprocal influence on the market was an intriguing thought that I wanted to explore further.
By leveraging AI's capability to discover patterns in the AIS data, we saw the potential to demystify these correlations and, perhaps, even predict market fluctuations. This could fundamentally shift the maritime industry's decision-making approach. The questions we aimed to answer were twofold. First, could state-of-the-art AI models identify patterns in the AIS data that could be leveraged to predict certain financial instruments in the maritime industry? And second, if these models proved effective, what insights could we obtain from their decision-making process?
The Problem with AI Interpretation
As AI models have grown in sophistication and capability, they have also become increasingly opaque. This is often referred to as the 'black box' problem, which means that while an AI model may be highly effective in its predictions or decisions, understanding how it arrived at those conclusions can be incredibly difficult. The world of AI is teeming with models like deep learning neural networks, which are famous for their superior predictive capabilities. However, these models' intricate layers of processing nodes and nonlinear transformations make them incredibly hard to interpret. As a result, they operate much like a black box, where data goes in, and answers come out, but the internal workings remain a mystery.
If we cannot decipher why our AI model made a specific prediction, it becomes difficult to determine if the model is basing its predictions on sound reasoning or exploiting some feature in the data that is not truly reflective of the underlying process. This issue introduces us to the concept of "Clever Hans" predictions. The term "Clever Hans" refers to a horse in the early 1900s who appeared to perform arithmetic and other intellectual tasks. However, it was later revealed that Clever Hans was reacting to his trainer's cues, not showcasing equine genius. Similarly, AI models might provide seemingly accurate predictions, even though they could be leveraging some unnoticed bias or artifact in the data instead of truly grasping the system's core dynamics they are meant to model. Over time, several Clever Hans predictors have emerged, particularly in image classification tasks. For instance, some models have incorrectly attributed success to identifying a consistent watermark for a certain type of image instead of understanding the actual content of the image.
XAI: The AI Interpretation Counterweight
The field of explainable AI (XAI) emerges as a counterweight to this black box problem, focusing on ways to interpret, understand, and evaluate the decision-making process of complex AI models. The key idea is to develop systems capable of both performing tasks effectively and providing human-understandable explanations for their actions. Several approaches to XAI have gained traction over the years and are mostly divided into inherent interpretable models, model-agnostic methods, and model-specific methods.
Inherent interpretable models, as the name suggests, are naturally interpretable models due to their directly interpretable structure, such as linear regression and decision trees. Still, this simplicity often comes at the cost of performance, particularly with complex, high-dimensional data. The following hypothetical example of a decision tree uses two hypothetical features (“build year” and “if it is fuel efficient”) to estimate the daily cost of a vessel (normalized). We observe that the decision-making process is entirely transparent and interpretable:
On the other hand, model-agnostic methods offer a versatile solution for XAI. These methods are designed to be used with any learning algorithm and operate by probing an already-trained model to understand its behavior. A common model-agnostic approach, and the one employed in my thesis, is SHAP (SHapley Additive exPlanations), which allocates contribution scores to features, which, when summed up, explains the prediction. The true strength of these model-agnostic methods lies in their universality, enabling their flexible application to any existing model:
Lastly, there are model-specific approaches tailored to particular types of AI models. These methods leverage the specific structure of a model to provide insights into its decision-making process. These methods can yield additional insights into a model’s decision-making but require technical knowledge of the models’ architectures.
Results and Discussion
Before diving into the results, I want to note that my master's thesis thoroughly documents the engines behind my work - the AI models and their technical implementations. Should you wish to delve deeper into the 'nuts and bolts' of the process, you're invited to do so. However, in this blog post, I will pivot away from the technicalities, shedding light on the practical outcomes and their implications instead.
A variety of state-of-the-art models were put to the test through multiple experiments. They were tasked with forecasting different financial instruments, all tightly linked to the maritime industry. The best-performing models were interpreted alongside experts from Maritime Optima to examine their decision-making processes. The financial instruments, each increasingly affected by external influences, served as a gauge for the AIS’s forecasting ability:
Baltic Dry Index: An economic indicator compiled by the Baltic Exchange that quantifies the cost of transporting various raw materials by sea.
Breakwave Dry Bulk Shipping ETF: A tradable instrument by Breakwave Advisors that replicates the daily performance of shipping freight futures, specifically, a portfolio of near-dated dry bulk freight futures.
Golden Ocean Group Ltd.: The stock price of Golden Ocean Group Ltd., a prominent global entity in the dry bulk shipping industry.
Frontline Ltd.: The stock price of Frontline Ltd., an industry leader in the international maritime transportation of crude oil.
Relying solely on AIS as their data source, the models exhibited remarkable precision in forecasting the dry bulk sector instruments. However, the AIS data was significantly scarcer for Tanker vessels compared to Dry Bulk vessels, potentially contributing to the less impressive performance in forecasting the Frontline stock price. A comprehensive overview of all the experiments can be found in my thesis, complete with an extensive appendix providing in-depth insights from the top models. However, for this blog post, I will mainly concentrate on the experiment related to the Baltic Dry Index.
Uncovering the Interplay Between the Baltic Dry Index and AIS Using AI
The Baltic Dry Index (BDI) is an economic indicator compiled by the Baltic Exchange that quantifies the cost of transporting various raw materials by sea. These commodities, typically transported in bulk, include items such as iron ore, coal, and grains. The BDI is calculated daily by a panel of ship brokers and their view on the current freight cost on various freight routes. The correlation between the BDI and freight rates suggests a close tie to the macroeconomic conditions and international trade patterns, rendering the index an optimal candidate for prediction models using AIS data. The following graph illustrates the data between 2019 and 2023 used to train and test the models, with the green area being used exclusively to test the models:
The best model, a CNN model, managed an MSE of 0.0025 after nearly 80 training epochs. This metric reflects the difference between each prediction and the actual value it intended to predict. I also employed CCC and Sign metrics to evaluate the models’ ability to model the instruments’ change over 14 days into the future. The model achieved a Sign of 0.7917 and a CCC of 0.8389, signifying that 79% of predictions had the same 14-day change direction and indicating a strong correlation (83.89%) between predicted and actual 14-day changes. Interestingly, the model outperformed an ARIMA baseline, which only managed a Sign of 0.6833 and a CCC of 0.1495. The model’s predictions are shown in the following figures:
Though there's always room for improvement, and the predictions aren't perfect, these forecasts are derived solely from AIS data, disregarding other macroeconomic variables that are usually used when forecasting these instruments. Bearing this in mind, the forecasts are surprisingly good, which made it sensible to explain them through XAI methods.
Again, the exact implementation and method for deriving the explanations can be found in my thesis, and I will only focus on the concrete results in this blog post.
The below figure illustrates the four main AIS variables used in the forecasts. For the BDI instrument, the model used the past 40 days of AIS data to forecast the instrument 14 days into the future:
Overall, the model demonstrated overall decision-making principles consistent with established knowledge, as depicted in the above figure, which showcases the average impact of each variable when looking back on the last 40 days.
The figure indicates that the model understands how extended travel time between ports typically corresponds to a lower market condition, as vessels typically reduce their speed to conserve fuel. Conversely, the model associates shorter durations with higher market conditions, consistent with how vessels adjust their speed. This is also in line with the contributions of the speed values, where the model assigns higher market values to higher speeds between ports, although this divide is not as clear, which could be due to the causal relationship between speed and duration, causing the model to use the duration variable to model speed.
In the case of the load factor, the model outlines a clear difference between higher and lower load factors and their effect on the market; the model assigns a higher BDI value when vessels are transporting less cargo than usual and vice versa for higher loads. This is particularly interesting as we would expect to see the exact opposite result; worse market conditions might result in vessels competing for suboptimal cargo loads, while a thriving market usually allows vessels to be fully loaded. Nevertheless, it’s not like the model shows uncertainty about this variable - there is a distinct division, which makes this observation particularly interesting.
Traffic, i.e., the current number of vessels en route, manifests greater complexity, indicating that traffic might behave variably across different ports and diverse timeframes, hinting at a more nuanced interaction with the market dynamics. To get a more detailed explanation, the below figure divides these per port-to-port relations for the top 10 most contributing features, with the impact of each feature shown on the x-axis (values to the left indicate a lower BDI), red colors indicating higher feature values, and vice versa for blue values:
This detailed view provides a more precise look into the decision-making process on a port-port basis. While most decision factors adhere to the overall trends shown in the previous figure, some prove to be exceptions. Notably, the duration from Changzhou to Port Hedland contradicts the overarching trend, with longer durations (and thus lower speeds) corresponding to a higher BDI value. At first glance, this may seem paradoxical, yet it reflects a real-world phenomenon. Port Hedland, for instance, often experiences high congestion levels during periods of market prosperity. In response, vessels may choose to travel at slower speeds to save fuel, anticipating a wait at the anchorage if they travel faster. Hence, while these explanations might not provide straightforward answers in certain situations, the model's deviations do align with reality upon closer examination. This results in something I refer to as “ambiguous explanations,” where the inverse of an explanatory variable, such as the duration between two ports, also holds true.
In the end, speculation could keep us occupied indefinitely. Therefore, I invite you, the reader, to delve deeper into these findings and engage in reflective exploration. I encourage you to consider potential reasons for these outcomes, question the patterns, and perhaps draw your own conclusions. For a more comprehensive understanding and additional explanations of all experiments and variables, please consult the Appendix of my thesis.
Potential Implications for the Maritime Industry
The findings of this study and the successful application of AI and AIS data will have several implications for the maritime industry in the coming years, which could potentially reshape the future of the maritime industry and business models. The maritime industry is seen as a complex but dynamic industry where stakeholders’ relationships are woven together in a manner that is hard to understand. The use of AI and XAI in my study has brought to light the interplay between AIS data and market trends and illuminated the connection between the operational and financial aspects of the shipping industry.
With the advent of AI-generated insights derived from the predictive powers of the AIS, maritime traders could gain a formidable competitive advantage. Traders, brokers, and operators may find themselves equipped with improved insights into upcoming market shifts, empowering them to make more informed and strategic decisions - paving the way for increased investment returns and minimized financial risk. This ability to forecast various shipping markets, such as the Baltic Dry Index and other financial instruments, is a powerful tool for many industry players. Accurate forecasting can help optimize operations, increase efficiency, manage risks, and contribute to strategic decision-making.
The success of AI and AIS, as illustrated in my research, may well fuel further innovations within the industry; by fusing AI with the extensive data available in the shipping industry, we could see a transformative change breaking on the horizon. Such a wave might wash ashore improved forecasting capabilities for various applications, ranging from fleet management and route optimization to safety and environmental impact assessments. The predictive capabilities of AI could also be useful in enhancing regulatory compliance within the maritime industry. For instance, understanding the patterns that lead to fluctuations in the Baltic Dry Index or similar metrics could help regulators develop better policies to ensure stability in the market and protect against potential manipulations.
Despite the potential transformation AI offers to the industry, it could also introduce various unwanted disruptions, especially with the policy discrepancies between countries engaging in the competitive arena that is global shipping.
As the future unfolds, only time will truly reveal its path. In the words of Yoda, “Difficult to see; always in motion is the future”.
Concluding Thoughts
This research is just a starting point, opening the door to a new wave of technological advancement in the maritime industry. It showcases the vast potential of AI in this domain but also highlights the value of interpretability. The coming years will undoubtedly witness further developments in this space as we continue to harness the power of AI and XAI to unravel the mysteries of the maritime world, making it a more predictable and transparent industry. This journey, although challenging, promises to be exciting and transformative. And as we venture deeper into this frontier, I am eager to see the ripple effects of these discoveries across the vast ocean of the maritime industry.
You can find my master’s thesis on NTNU Open once it has been published.