Global Trade is the vein bringing wealth to the global population
Global maritime traffic and the numerous sea routes around the world are both fascinating and important. They not only affect companies engaged in maritime activities but also have an impact on all industries and consumers. These sea routes are used by a wide array of vessels, facilitating the transportation of diverse commodities from cargo owners and producers to their respective customers and consumers. The British economist David Ricardo was among the pioneers to recognize the significance of global trade. In the 1800s, through his studies, he formulated the classical theory of comparative advantage in 1817.
Microsoft’s CoPilot defines global trade as "a dynamic force that connects us, fuels prosperity, and enriches our lives by bridging cultures, economies, and aspirations." Since the dawn of civilization, humans have engaged in trade with one another. Initially, this was limited to neighboring communities. However, as transportation methods improved, allowing for longer distances to be traversed via sea, air, roads, railway tracks, etc., goods and cargoes began to be shipped to all corners of the globe.
Global trade enables consumers and countries to access goods and services that may not be available domestically or are more costly locally, as different countries possess varying assets and natural resources (land, labor, capital, technology). By engaging in global trade, countries can specialize in producing goods more efficiently and distribute them to where they are most needed.
The role of straits, canals and narrow waterways
Straits, canals, and narrow waterways play a critical role in global maritime transportation, facilitating significant ship movements each year owing to their strategic locations and economic importance.
Safe navigation and the security of the seas are regulated by the United Nations through the specialized agency IMO (the International Maritime Organization). The United Nations Convention on the Law of the Sea (UNCLOS) has established a global legal framework for maritime traffic, which includes rights to pass through important straits within countries' national territories.
The right for a transit passage is specified in Article 38 of UNCLOS, regulating the most important straits for international maritime traffic:
The Strait of Gibraltar (provides access in and out of the Mediterranean Sea)
The Strait of Hormuz (provides access in and out of the Arabian Gulf)
The Straits of Malacca (passing Singapore)
The Bosporus Strait (provides access in and out of the Black Sea)
The Dover Strait (English Channel)
The Bab el-Mandeb Strait (provides access in and out of the southern part of the Red Sea)
The Panama Canal (built to reduce sailing time between the Far East and Europe)
The Suez Canal (built to reduce sailing time between the Far East and the USAC)
The Northeast Passage (also known as the Northern Sea Route)
The Strait of Taiwan
The Straits of Magellan (located south of Argentina and Chile)
Although the Kiel Canal stands as the world's busiest artificial waterway, with nearly 30.000 vessels transiting annually, it is not regulated by the UNCLOS laws at Sea.
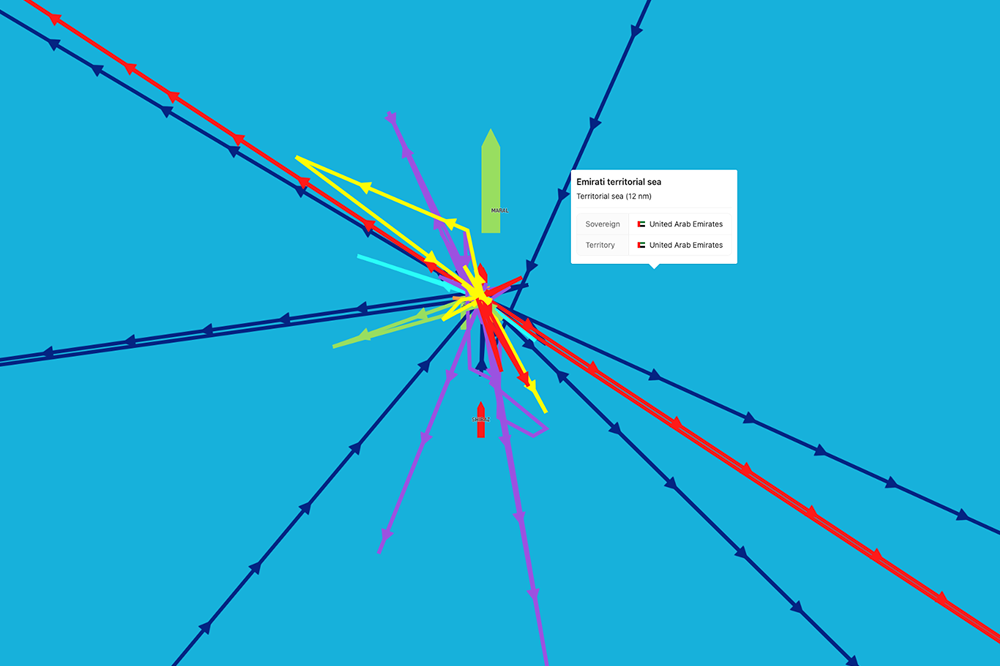
Below you can see a ShipIntel map displaying war zones, anti-shipping activities, and some of the primary global sea route waypoints. Maritime Optima make maps and software designed to aid shipowners, cargo owners, and brokers in making more informed decisions.
Screenshot of ShipIntel, showing a map with various layers displaying war zones, anti-shipping activities and some of the primary global seaway waypoints
How does maritime distances affect logistics costs?
Let's delve into the distances between the Far East and Europe, as well as the Far East and the US Gulf (USG), and examine the diverse sea route options. These routes present differing sailing distances and associated risks.
Route
Suez
Hope
Horn
Panama
North East Passage
Rotterdam > Chiba
11.205
14.459
16.691
12.594
6.851
Houston > Chiba
14.607
15.849
16.748
9.263
10.664
Table 1: Distances for different distances
Different types of vessels have varying service speeds, which directly impact the duration of voyages. One of the primary motivations behind the construction of the famous Suez Canal (opened in 1869) and Panama Canal (opened in 1914) by the French was to shorten the distance and reduce the number of days required to transport goods from East to West and vice versa.
Hence, for global maritime traffic, ensuring the accessibility and safety of these maritime straits is of utmost importance. These straits play a critical role in reducing sailing distances between production sites and markets, ultimately facilitating efficient transportation of cargoes and goods.
The closure of certain straits due to wars or anti-shipping activities results in increased transportation costs for bulk cargoes or consumer goods. This is because vessels are forced to navigate longer sailing distances, bypassing these closed straits by traveling around South Africa in open international waters, and/or higher insurance premiums to the heightened risks associated with alternative routes.
South Africa serves as a safe spot or waypoint for vessels sailing from East to West and vice versa, located in international waters and offering a secure passage for maritime traffic.
Here is how the speed influence number of days to perform a sea route:
Rotterdam > Chiba
Knots per day
Suez
Hope
Horn
Panama
North East Passage
10
47
60
70
52
29
15
31
40
46
35
19
20
23
30
35
26
14
Table 2: How the speed influence number of days to perform a sea route from Rotterdam to Chiba
Houston > Chiba
Knots per day
Suez
Hope
Horn
Panama
North East Passage
10
61
66
70
39
44
15
41
44
47
26
30
20
30
33
35
19
22
Table 3: How the speed influence number of days to perform a sea route from Houston to Chiba
According to historical AIS, the average service speed (from the AIS) for different type of vessels larger than 10 000 dwt during the last 6 months are:
Dry bulk
10-11 knots
Tankers
10-11 knots
LPG
13-14 knots
LNG
14-15 knots
Chemicals
10-11 knots
Container
13-14 knots
Car carriers
14-15 knots
Table 3: Average speed for different types of vessels (we have deducted the time the vessels performed lower than 3 knots)
According to Maritime Safety Information there were reported 185 anti-shipping activities in 2023, and in 2022 there were 248. So far in 2024 there have been reported 123 anti shipping activities. Every time an anti-shipping activity is reported, the ship and cargo owners, ship and cargo operators and their brokers, knows their business might be changing.
The people involved in maritime business follow the news and continuously search for information in real-time to be pro-active, mitigate losses and look for opportunities. However, historical information is important to better understand real-time activities and compare these with previous events, helping them make more qualified decisions without taking on too much (new) risk and additional costs.
There are several sea route options to/from the Far East (incl Middle East) to North Europe. In ShipIntel you will find a sea route calculator helping you study different sea route alternatives, showing you nautical miles, time, costs and risks involved, enabling you to quickly find which sea-route you want to plan for your vessels.
Screenshot of ShipIntel, displaying different sea route options from the Far East to North Europe
What are the consequences of vessels selecting a longer sea route?
The sea route from Aden to Suez to Gibraltar is the most frequently used route from the Far East to Europe and vice versa, while the most popular alternative route is via Cape of Good Hope.
Due to attacks by the Houthi group on vessels in the Bab el-Mandeb Strait (Strait of Aden), maritime traffic is avoiding the commonly used route through the Suez Canal. This avoidance is causing significant losses for Egypt, as revenue from sea passages through the Suez Canal is Egypt’s primary income source. As of January 2023, monthly revenue from the Suez Canal reached 23 billion Egyptian pounds (approximately 743 million U.S. dollars) (Source: CoPilot).
Looking at table 2, sailing around Cape of Good Hope from Chiba to Rotterdam at 15 knots takes an additional 9 days compared to passing through the Suez Canal. Assuming vessels consume 35 mt (metric tons) of fuel per day, this equates to 315 mt for one leg, and over 600 mt for both legs. This results in an increase in carbon emissions of 985 mt (for just one vessel) compared to sailing through the Suez Canal. In 2023, more than 20,000 vessels passed through the Cape of Good Hope.
The graphs below show the selected sea routes for all type of vessels in 2022 and 2023, and in January 2024.
Graph 1 and 2: Selected sea routes for all types of vessels in 2022, 2023 and January 2024, through Suez and Good Hope
It's evident that the Houthis control of Bab-el-Mandeb Strait, the Israeli war and the Panama Canal facing water shortages due to climate change, numerous vessels, regardless of type, opt to sail around the Cape of Good Hope.
This results in more carbon emissions, higher tax for carbon emissions, higher bunker costs and then higher freight rates.
Graph 3 and 4: Number of passages East/West or North/South) for LPG, Dry cargo, tankers, LNG, Chemicals, Container and car carriers distributed on each month in 2022, 2023 and Jan/Febr 2024.
The graphs above shows number of passages (East/West or North/South) for LPG, Dry cargo, tankers, LNG, Chemicals, Container and car carriers distributed on each month in 2022, 2023 and Jan/Febr 2024.
Do all type of vessels follow the same sea routes?
No, not necessarily. Different types and sizes of vessels may follow different sea routes. Container vessels and dry bulk vessels, for example, have distinct trading patterns. However, they all share a common desire to avoid interference in war and conflicts.
The type of sea route selected by different types of vessels depends on various factors, including war risk, the risk of delays and potential penalties, fees for canal passages, availability and cost of bunker fuel along the sea route, weather forecast, and insurance premiums.
Graph 5 and 6: Number of passages through Suez based on vessel type (Container and LPG)
Historical and live AIS trades
In ShipIntel, users have access to historical trade data as well as real-time AIS data for vessels. This enables users to quickly obtain an overview of any fleet or type of vessels they are interested in. With real-time AIS data, users can track vessel movements as they happen, allowing for up-to-date monitoring of maritime activities. Additionally, users have the option to set up notifications for specific vessels or lists of vessels, ensuring they are informed about any changes in trading patterns as they occur.
Live AIS trades, tracks and sea route for LPG carriers
In the picture below you can see live AIS trade, tracks, and sea routes for LPG (Liquefied Petroleum Gas) carriers, in ShipIntel. By clicking on any of the vessels on the map, users can access their real-time track as well as historical data attached to each vessel.
Screenshot of ShipIntel, displaying live and historical AIS data for a specific vessel
If you're interested in studying port areas and changes in sea route statistics, as well as receiving real-time notifications about maritime traffic changes in specific areas, anchorages, ports, and crossing lines, you should explore the Port and Area Monitoring module in ShipIntel:
Screenshot of ShipIntel, displaying an overview of a specific port
Maritime Optima: Maritime intelligence at your fingertips.
ShipIntel helps maritime professionals make better decisions. Contact us today to book a free demo or continue to explore our webpages to learn more.